Tutorial · 7 min read
Compare automatic versus manually coded emotions
Learn how to use INTERACT to compare automatically detected emotions with manually coded observations for more comprehensive behavioral analysis.

Learn how to compare automatically observed emotions with manually collected observations in INTERACT.
Challenge & Goal Summary
Aim of this study is to compare automatically detected emotions with manually coded emotions.
We want to extract the periods of explicit emotions from automatically measured data in order to watch those fragments in the video. Additionally, we want to simultaneously display the stream of measured emotion-values when the video plays.
Most important though, is the ability to find contingencies and co-occurrences between visual observations, topics discussed and the emotional reactions of the two participants.
The biggest challenge we face here is:
- Extracting usable fragments for specific automatically measured emotions. This means we need to turn frame-based measures into behavioral Events whenever a certain value is exceeded.
- Integrate full natural spoken word transcriptions during observation.
The goal is:
- Compare automatically measured positive emotions with manually logged sequences, during which the observer interpreted the expression as positive.
- Find co-occurrences between speaker and measured emotions.
- Analyze use of words per participant.
This is how you can do it:
Study Design
The source we use is a recorded television debate between the politicians Mrs. Merkel (CDU) and Mr. Steinbrück (SPD). The video is processed by a system that automatically detects emotions. It is also manually coded with the Mangold INTERACT software. To synchronize and integrate the measured values, the add-on tool is required as well.
Data Collection
To collect automatically recognized emotions, the video was processed by the Microsoft Emotion API service1, which analyzed the video frame by frame, resulting in a long list with measured values.
Additionally, Mangold INTERACT is used to score all observations, starting from camera view and current speaker to gestures and observed expressions.
Prepare Data Logging
For the data collection with INTERACT, we prepared multiple code definition files to be used in different passes through the video. Per pass, a different set of Codes can be used, to limit the number of codes to chose from. To optimize the coding process per pass, it is even possible to apply different coding mode within the same document.
For our experiment we at least need a set of ‘Emotion’ or ‘Affect’ codes, because we want to manually observe and log any positive and negative affects per participant as they occur. So consider a class ‘Emotion_M’ and ‘Emotion_S’, both with the codes ‘Positive’, ‘Neutral’ and ‘Negative’.
As mentioned, further information was also collected, but that information is not important for this comparison, so we concentrate on the Emotion data.
Collect Observations
If you need multiple passes to collect your data, start with information that is easy to observer, like who is in camera view, specifying for instance the focus and the people that are currently visible. Detecting more complicated behavior is easier if you watched the video before.
Once you get to logging the ‘Emotions’ you can use the previously coded ‘in camera view’ Events for the particular participant to quickly find the parts of interest in the video (you can skip the parts where your person of interest is not visible)
Details on how exactly to log your codes is not part of this example, so we skip that an presume the data was already collected.
Analysis
Before we can compare the automatically generated data with the manually coded data and watch this data in-sync with the video, we need to import the measured data into Mangold DataView.
Import Emotion Data
Importing any kind of measured data relies on knowing the exact synchronization point between video and data. In this case synchronization is easy, because the emotion values start at the very beginning of the video.
The DataView import wizard guides you through the import process, but again that is not part of this example.
After successfully importing the emotions data and creating a custom layout in DataView, showing a separate chart per person (to bundle the measured emotions for both participants), our setup looks like this:
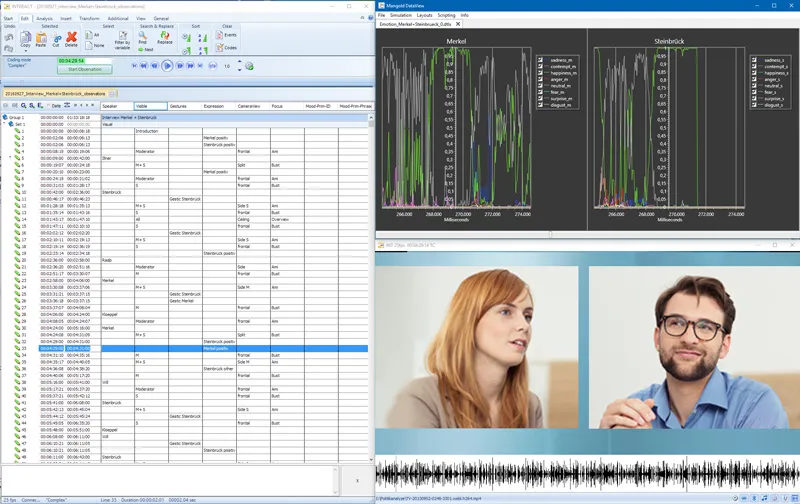
Mangold DataView and Mangold INTERACT hook up automatically, based on the time information of the video and that of the measured values. Playing the video makes the emotion data-charts run in-sync. Replaying any of the manually scored events automatically shows the corresponding emotion values in the charts.
To compare the results of the automated emotion detection software with the manually coded data and the video in a detailed way, we need to transform the measured values into INTERACT-Events.
The software used to detect emotions automatically provides values between 0 an 1 per video frame. The resulting values are stored in different ‘emotion channels’. This system always detects a combination of characteristics for multiple emotions simultaneously, so we need to interpret these values to extract Emotional Events for Positive and Negative Affect.

Extract Emotional Events
Based on the measured values per emotion channel, we create INTERACT-events from within DataView.
A scripting routine can generate Events based on channel data. You can select a channel and a threshold value, after which all succeeding lines that meet the specified threshold are joined into a single INTERACT- event.
This way, we can generate events with a code ‘Happy’ covering all periods in which the ‘Happy’ channel for Mrs. Merkel rises above 0.7, same for Mr. Steinbrück of course.
Also of interest for our study, are the sequences where the ‘Anger’ channel of the participants rise above 0.7, to generate negative affect events.
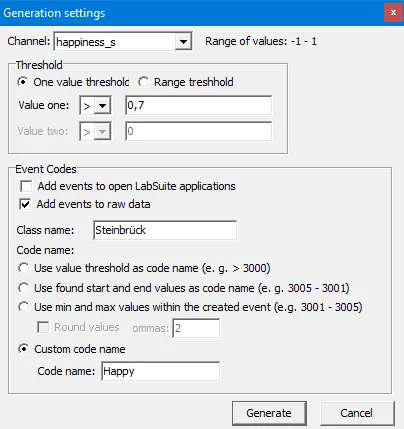
In DataView, we can specify the Class-column and the behavioral Code for each threshold-based search separately. Generating all the sequences for positive and negative affect for both participants only takes four separate runs of the same routine with adjusted settings.
All in all, this will take 5 minutes max!
Now we can compare the statistics on our manually coded ‘positive’ expressions and the automatically generated events for ‘Happy’ in the Full statistics.
We can also verify the expressions visually by replaying the events that were generated by DataView, based on the measured values, or coded manually.
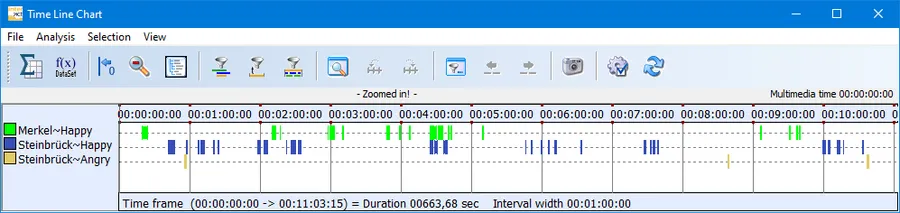
Statistics tells us, that Mrs. Merkel might be registered as ‘happy’ quite often (Frequency=51), but it usually lasts for less than half a second (Mean duration):
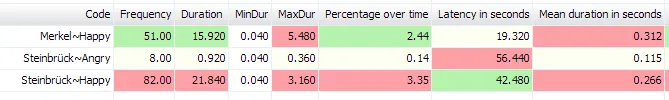
Statistics also tells us, that although Steinbrück seems to be ‘happy’ more often than Merkel both based on frequency and duration, Merkel is the one who ‘laughed’ the longest (max. duration of ‘happy’).
Comparing the codes generated by DataView with the manually logged observations show a big difference between what is considered positive affect according to the two methods, simply by looking at the plain statistics only. Adjusting the threshold can optimize the results for a better match. No need for the co-occurrence routine for that.
Co-occurrences
Comparing the measured emotions for Merkel or Steinbrück per speaker turn can be handled by the State-Space-Grid. In the picture you can see the measured emotions from Steinbrück compared to the current Speaker:

Even without the fancy extraction of automatically detected emotions, the scoring of speaker-time gives us some interesting information. For example: the “Trim on code”-filter provides us with the details of who else spoke during Steinbrück’s or Merkel’s speaking time:
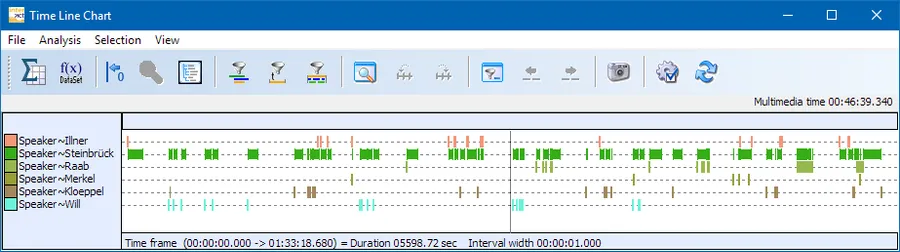
Because the INTERACT statistics only reflect what is currently visible in the Time Line Chart, limiting the Events displayed automatically adjusts the statistics accordingly.
Use of words
We made a full transcription of the speaker turns, entering the transcription per Speaker-event into the Transcription area in INTERACT. To analyze the wording per speaker, we need to reorganize all speaker Events and group these into a separate DataSet per Speaker. This can be done with a few mouse clicks, using one of the powerfull Restructuring commands. Once all speaker turns are grouped per Speaker, the Text Analysis statistics show you at a glance what are the most favorite words of our speakers
INTERACT: One Software for Your Entire Observational Research Workflow
From audio/video-based content-coding and transcription to analysis - INTERACT has you covered.