Product · 3 min read
The Power of Mangold DataView
Discover how to synchronize bio-physiological sensor data with video recordings for comprehensive research and analysis using Mangold DataView
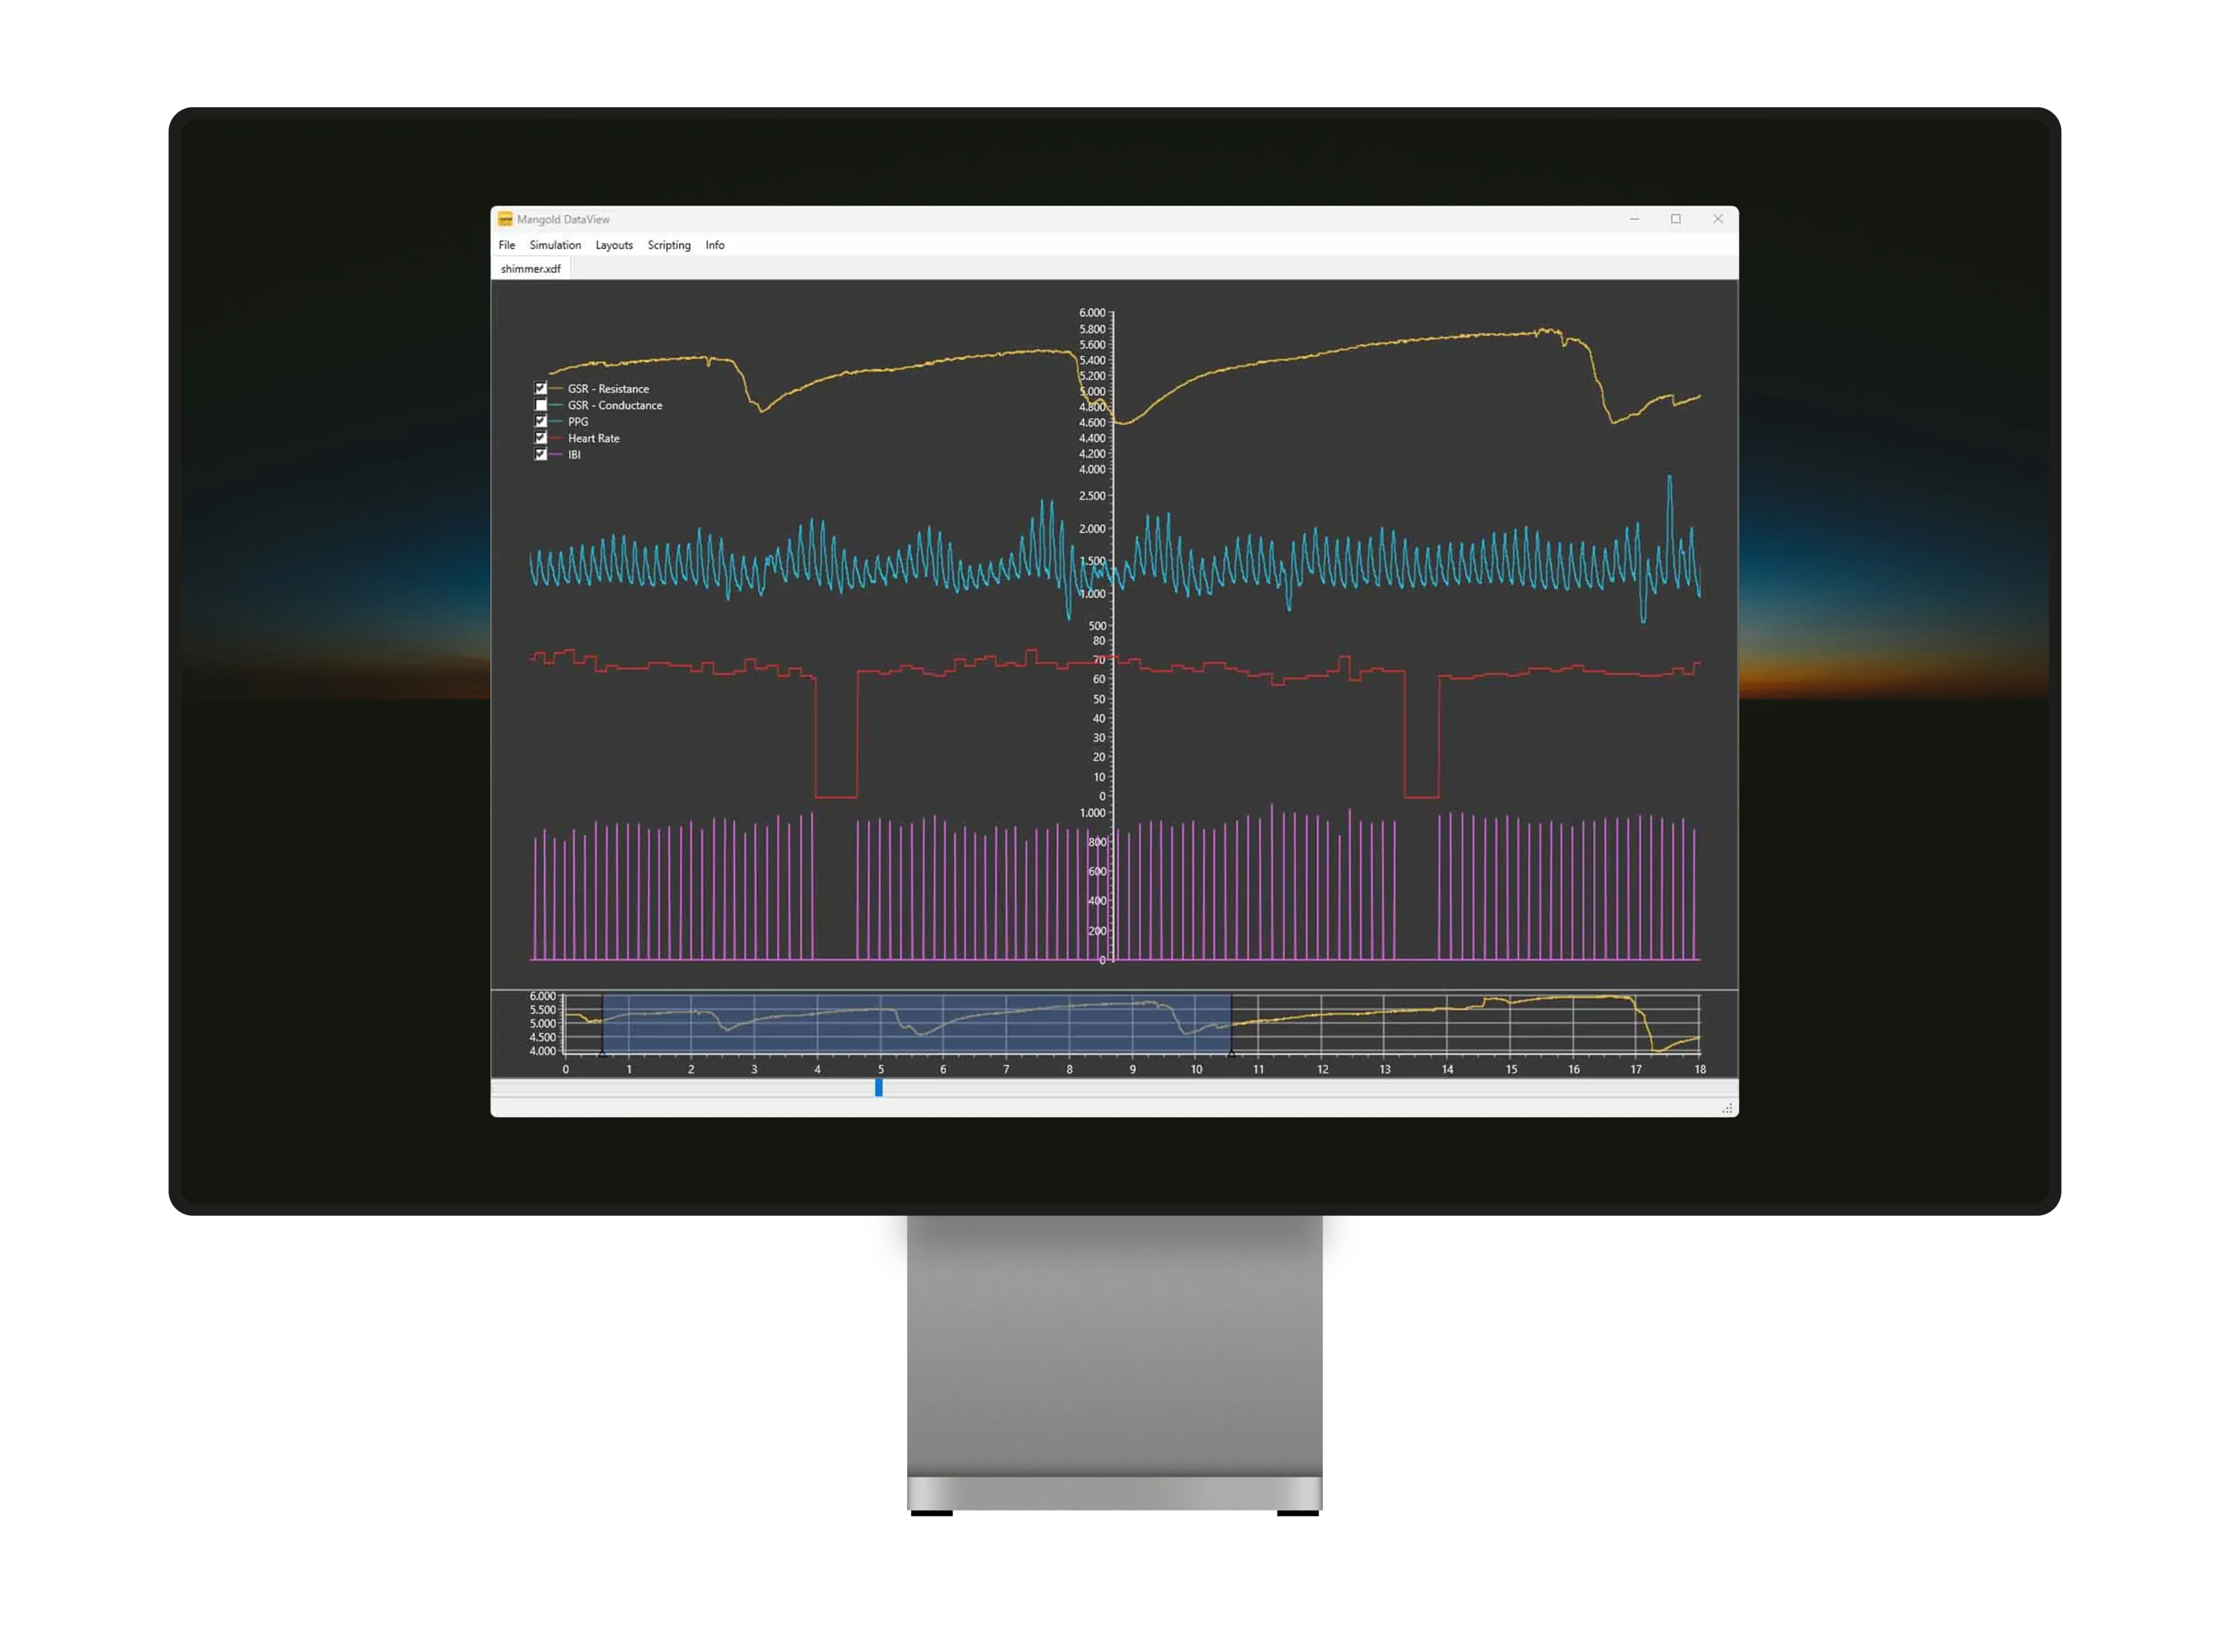
Mangold DataView is a software tool designed to visualize measured data values in an interactive graph. It serves as an add-on to multiple Mangold products but can run as a stand-alone application.
This post concentrates on the combination of Mangold DataView and Mangold INTERACT.
This perfect match aims to help researchers analyze and visualize measured data from various sources in combination with audio and video material.
The software is particularly useful for researchers that collect bio-physiological or other sensor data while recording the test situation for in-depth analysis.
One of the key features of Mangold DataView is its ability to handle data from a wide range of sources. The software can open EDF and BDF files and import data from systems that provide its measurements in a table-structured _.txt or _.csv file.
This makes it a versatile tool for all researchers that need to combine video-based observations and measured values.
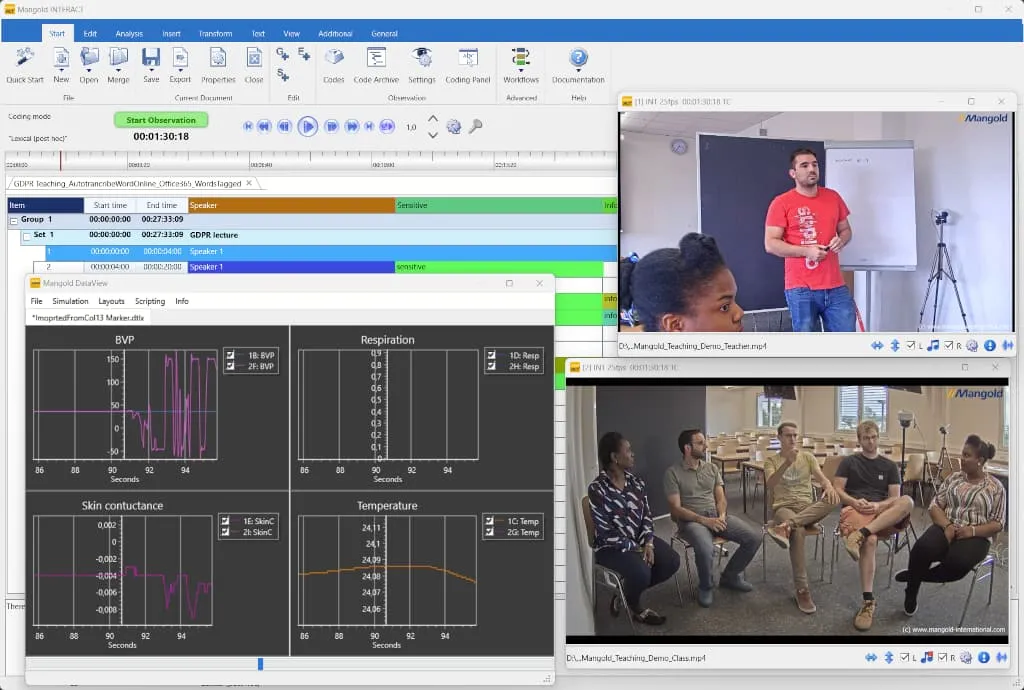
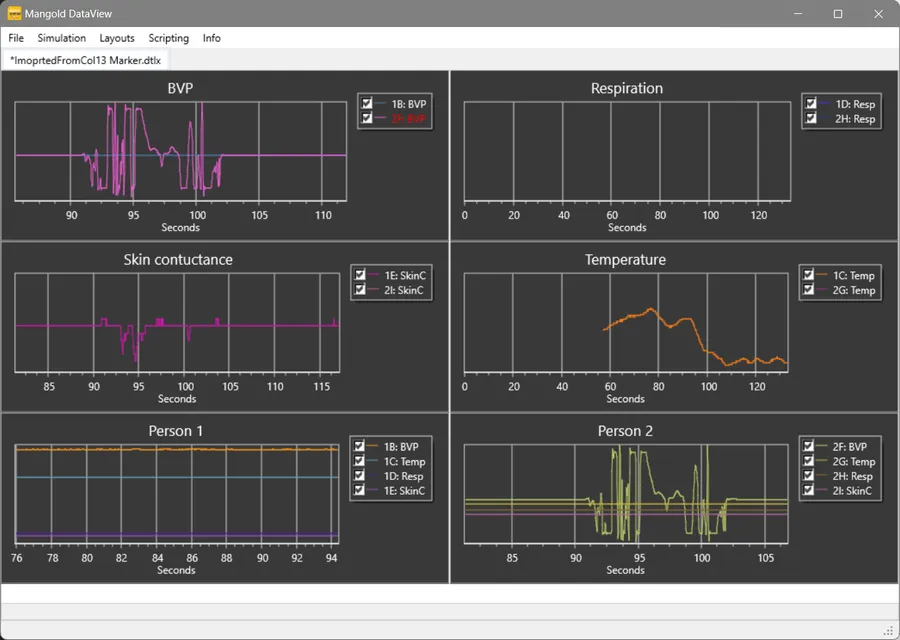
Once data has been imported into Mangold DataView, researchers can create multiple graphs to combine visualization of specific value types logically. DataView’s ability to run those graphs in sync with the videos played by Mangold INTERACT is a fantastic feature.
Both applications hook up automatically, and synchronization is based on the time information available on both sides. This allows for a number of synchronization scenarios to work.
You can run both Mangold INTERACT and Mangold DataView on Windows and macOS. The fact that synchronization works instantly, even when running both applications on separate computers within the same network and even across different platforms, is very impressive.
The real power of DataView, combined with INTERACT, lies in the ability to exchange data between INTERACT and DataView.
This unique and useful feature enables researchers to generate events in INTERACT based on the values of a specific channel and, the other way around, add observational codes to values measured during those events, allowing for even more detailed analysis and enriched data. Enabling researchers to gain more and probably wholly new insights into their data.
- Create Events For example, you can create Events for all situations where the skin conductance or heart rate values rises above a specific value. Then you can review those sequences in INTERACT to see what happens during or just before those situations.
- Copy Behavioral Codes By copying behavioral Codes from INTERACT to DataView, you can enrich your plain measures with visual observations and use that combined information for further analysis in R or other third-party tools.
- Compute Statistical Values Based on behavioral Codes from Mangold INTERACT, Mangold DataView can compute statistical values.
In summary, Mangold DataView is a powerful tool for researchers who need to analyze and visualize complex data sets. With its flexible import options, powerful analysis tools, and integrated programming language for creating custom plugins, Mangold DataView can help researchers in many different fields gain new insights into their data.
Sync. Analyze. Understand.
Mangold DataView enables researchers to synchronize and analyze various measurements with observational data, providing deeper insights.