Tutorial · 4 min read
Create Full Statistics with INTERACT
Learn how to generate comprehensive descriptive statistics including frequency, duration, temporal percentages and latencies with just a few clicks in Mangold INTERACT.
The first step in a comprehensive data analysis is to familiarize yourself with the data and examine its potential informative value. To do this, you can, for example, look at descriptive statistics about the data, such as frequency, duration, temporal percentages and latencies. With INTERACT, you can get these results of your content coding with just a few mouse clicks.
TIP: Those statistics make most sense for all data at once, so we advise to first merge your data into one big compilation file.
Chronological visualization
You can visualize all behaviors or just a part of your data, depending on your current needs.
- Click Analysis - Data Set - Main Statistics.
- Select the Codes and Classes you are interested in - per default all Codes are selected.
- In case you have multiple DataSets, select the DataSets you want to inspect (CTRL+A selects them all).
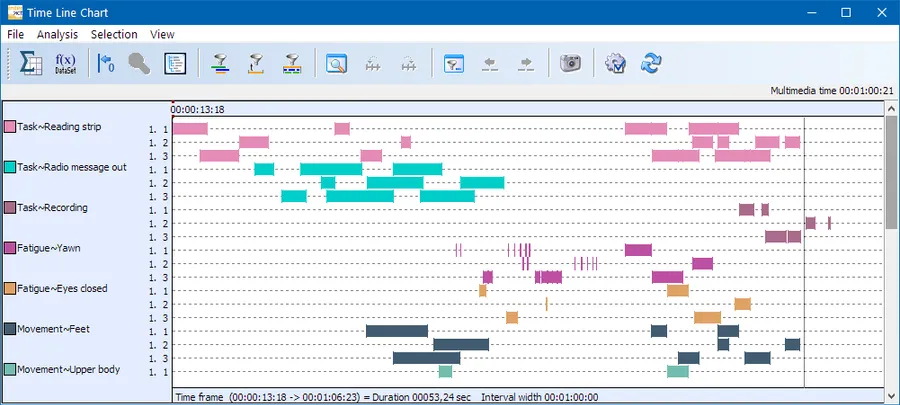
The Time Line Chart window appears, showing all selected Codes of all selected DataSets on a chronological time line, like this:
The numbers in the legend (1.1, 1.2, 1.3 etc.), stand for DataGroup. DataSet as listed in your data file. In this example, we selected DataSet 1 and 3 from DataGroup 1, as well as DataSet 2 from DataGroup 2.
All Codes are displayed in bars, indicating the length for each period a Code was logged.
Number crunching
You can easily limit the number of Codes that are analyzed or reduce the time frame for the analysis, because only data that is currently visualized in the Time Line Chart window is reflected in the statistics!
- Within the Time Line Chart window, click Full statistics
The different metrics are now available on different tabs:
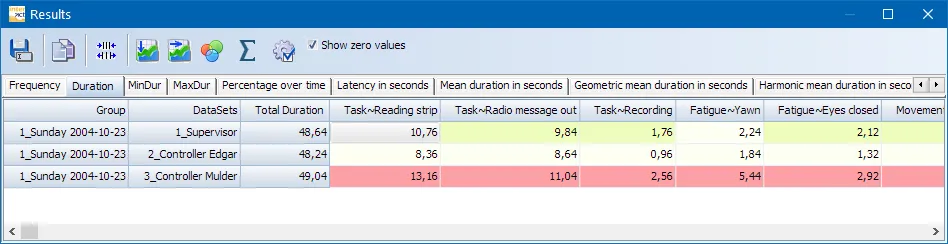
One Dimension per Tab
Each type of statistical value is available on a separate tab. Per default all durations are listed in seconds and milliseconds, but you can pick the format you prefer in the time format settings, available through the little gear icon.
Per default INTERACT displays only Codes from the current data file. If you want to see all Codes that are available within the current Code Archive, simply select Show zero values.
TIP: The order of the listed Codes, is determined by their order in the assigned Code Archive. The current Code Archive can be accessed from within the Time Line Chart through the Code Archive icon (5th icon). Details on the Code Archive can be found in the INTERACT Help file.
Summary per value
A summary over the totals per Code of all listed DataSets is available with a single mouse click:
- Click the Summary button to extend the current Results table like this:
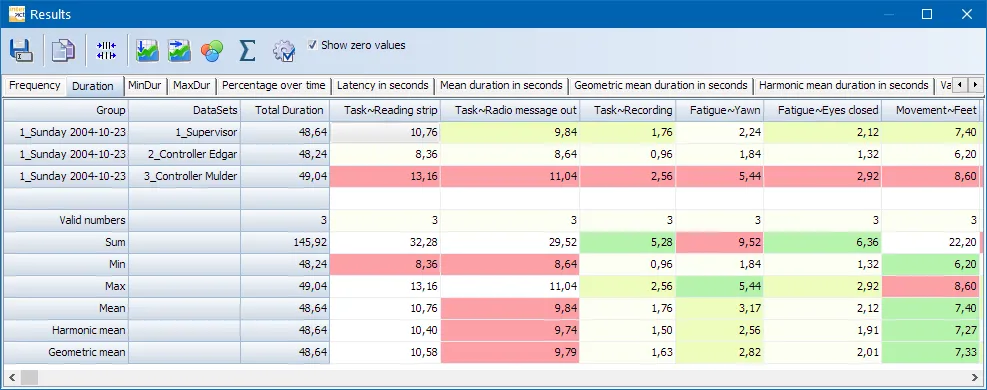
The available values tell you this:
- Valid numbers: Number of valid values found in the table for that specific column = number of DataSets.
- Sum: Total of the listed values
- Min: Smallest value per Code
- Max: Highest value per Code
- Harmonic mean: Calculated of all listed values per Code - best applicable for rating values. Thus in this overview mainly useful for rating values within Independent variables.
- Geometric Mean: Calculated of all listed values per Code.
Visual Data Exploration
You have probably noticed the different colors in the results window. Those are the result a special visual data exploration function, which is active per default:
The icon Visual Data Exploration in the toolbar, allows you to (de)activate this functionality.
Your results may be colored like this:
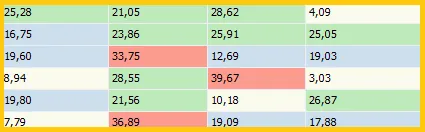
All values are compared and the range, between the lowest and highest value, is used to split the results into four groups:
- Beige is used for the values within the lowest 25%
- Blue is used for the values within the next 25%
- Green is used for the values within the third 25%
- Red is used for the values within the highest 25%
This gives you immediate visual feedback on your results.
In INTERACT 20, you can adjust the color scheme in the application settings under Behavior > Colors.
Charts
The values displayed in the Full Statistics Results can be copied or saved for further processing in third-party applications like MS Excel, or R to create the charts you need.
INTERACT: One Software for Your Entire Observational Research Workflow
From audio/video-based content-coding and transcription to analysis - INTERACT has you covered.