Know-How · 8 min read
Navigating Multimodal Data in Observation Labs | Mangold
Explore multimodal data challenges in observation labs, from synchronization and sampling-rate mismatch to annotation, statistical modeling and machine learning.

Navigating the Complexities of Multimodal Data
Multimodal data plays a central role in modern behavioral research and observation labs, but integrating multiple synchronized data streams introduces technical and analytical challenges. This article explains how researchers address hardware compatibility, data formats, temporal alignment, annotations, statistical modeling and machine learning to turn complex observational data into meaningful insights.
1. Challenges & Limitations: Navigating the Complexities of Multimodal Data
While the opportunities presented by advanced observational research labs are immense, their implementation and operation are not without significant technical challenges. Overcoming these limitations is crucial for ensuring data quality, analytical validity, and the overall success of research endeavors. Researchers must be acutely aware of these potential pitfalls and proactively design their systems to mitigate them.
Compatibility Issues: The Heterogeneous Hardware Landscape
One of the most pervasive challenges in building a multimodal lab is dealing with Compatibility Issues between different hardware components and software systems. Sensors from various manufacturers often use proprietary drivers, communication protocols, and data formats, making it difficult to integrate them seamlessly. A new sensor might require specific operating system versions, conflict with existing drivers, or demand unique hardware interfaces. This can lead to:
- Hardware Driver Conflicts: When drivers for different devices interfere with each other, causing system instability, crashes, or preventing devices from functioning correctly.
- Software Incompatibilities: When data acquisition software from one vendor cannot properly interpret or control hardware from another, or when analysis software struggles to import data from diverse sources.
Addressing compatibility often involves extensive testing, custom driver development, or the use of middleware solutions (like LSL) that abstract away hardware-specific details. Careful planning and selection of components with open standards or well-documented APIs can significantly reduce these issues.
Data Format Inconsistency: The Babel of Data
The variety of sensors and software leads directly to Data Format Inconsistency. Each sensor or software platform may output data in its own unique format (e.g., proprietary binary, CSV, EDF, HDF5, custom XML). This creates a
significant challenge for data integration and analysis, as researchers often spend considerable time writing conversion scripts or manually reformatting data. This ‘Babel of Data’ hinders efficient workflow and increases the risk of errors during data manipulation. Standardized data formats (e.g., BIDS for neuroimaging) are emerging but are not universally adopted across all sensor types.
Sampling Rate Mismatch: The Temporal Resolution Divide
Different sensors operate at different Sampling Rates, leading to a Sampling Rate Mismatch across data streams. For example, an EEG system might sample at 1000 Hz, an eye-tracker at 240 Hz, and a video camera at 60 fps. When integrating these data, researchers must decide how to handle these discrepancies. Downsampling higher-frequency data or upsampling lower-frequency data can introduce artifacts or reduce temporal precision. Proper interpolation techniques are required to align events accurately, but these can be computationally intensive and require careful validation to avoid distorting the original signal.
Manual Synchronization: Labor-Intensive and Error-Prone
In the absence of robust automated solutions, Manual Synchronization becomes a significant challenge. This often involves using shared event markers (e.g., a flash on the screen, an auditory beep) that are simultaneously recorded by all sensors. Researchers then manually align data streams based on these markers in post-processing. This process is incredibly labor-intensive, time-consuming, and highly susceptible to human error, especially in long recordings or experiments with many participants. Even small inaccuracies in manual alignment can lead to erroneous conclusions, particularly when analyzing rapid behavioral or physiological events.
Bandwidth Limitations: The Data Bottleneck
Multimodal data collection generates enormous volumes of data, especially with high-resolution video and high-sampling-rate physiological sensors. This can quickly lead to Bandwidth Limitations within the lab’s network infrastructure. Insufficient network bandwidth can result in data loss, dropped frames, or increased latency, compromising the integrity of the collected data. Designing a network capable of handling simultaneous high-throughput data streams from multiple sensors requires careful planning, often necessitating dedicated gigabit or 10-gigabit Ethernet connections, and high-performance network switches.
Latency Variability: Unpredictable Delays
While latency (the delay between an event and its recording/processing) is a general concern, Latency Variability poses a particular challenge in real-time and closed-loop systems. If the delay is inconsistent and unpredictable across different data streams or over time, it becomes impossible to accurately synchronize events or provide timely feedback. Factors contributing to latency variability include network congestion, operating system scheduling, driver inefficiencies, and computational load. Minimizing and quantifying latency variability is crucial for maintaining the temporal integrity of multimodal data and ensuring the validity of real-time interventions.
Clock Drift Correction: Maintaining Temporal Alignment Over Time
Even with initial synchronization, the internal clocks of different devices can gradually diverge over time, a phenomenon known as Clock Drift. This drift, though often small (e.g., parts per million), can accumulate over long recording sessions, leading to significant temporal misalignment between data streams. Clock Drift Correction mechanisms are essential to maintain precise synchronization throughout an experiment. This often involves periodic re-synchronization using a master clock (e.g., via PTP or LSL’s internal algorithms) or post-hoc algorithms that estimate and correct for drift based on shared timing signals. Without effective clock drift correction, the temporal relationships between events recorded by different sensors can become unreliable, undermining the validity of multimodal analysis.

2. Analysis & Interpretation: Extracting Insights from Multimodal Data
Collecting high-quality multimodal data is only the first step; the true value of an observational research lab lies in its ability to transform this raw data into meaningful scientific insights. The analysis and interpretation phase is complex, requiring specialized tools and methodologies to handle the volume, velocity, and variety of data generated. This section outlines key approaches to extracting knowledge from multimodal observational datasets.
Behavioral Timelines: Visualizing the Sequence of Events
Behavioral Timelines are fundamental for visualizing and analyzing the temporal progression of events and states within an observational study. These timelines graphically represent the onset, duration, and offset of various behaviors, physiological responses, and external events, all aligned to a common time axis. They allow researchers to:
- Identify sequences and patterns: Observe how different behaviors or physiological changes unfold over time and in relation to each other.
- Detect correlations: Visually identify potential relationships between different data streams (e.g., a specific action followed by a change in heart rate).
- Segment data: Define specific periods of interest for more detailed analysis based on the occurrence of certain events.
Software platforms like Mangold INTERACT are designed to facilitate the creation and manipulation of these timelines, allowing for both qualitative inspection and quantitative analysis of temporal relationships.
Event Annotations: Structuring Qualitative Observations
Event Annotations are the process of adding descriptive labels or codes to specific points or segments within the raw data streams (e.g., video, audio). This transforms qualitative observations into structured, quantifiable data. Annotations can describe:
- Discrete events: Such as a specific gesture, a verbal utterance, or a button press.
- States: Such as a period of engagement, confusion, or relaxation.
- Contextual information: Such as the presence of a specific stimulus or the start/end of a task phase.
High-quality event annotations are crucial for subsequent statistical analysis and machine learning applications. The reliability of these annotations is often assessed using inter-rater agreement metrics.
Inter-rater Agreement (Cohen’s Kappa): Ensuring Objectivity
When multiple human coders are involved in annotating behavioral events, it is essential to quantify the consistency of their observations. Inter-rater Agreement, commonly measured using Cohen’s Kappa, assesses the level of agreement between two or more independent observers, correcting for agreement that might occur by chance. A high Kappa value indicates that the coding scheme is clear and applied consistently, enhancing the objectivity and reliability of the behavioral data. Low Kappa values signal ambiguity in the coding scheme or inconsistencies in coder application, necessitating refinement of the coding manual or additional training for coders. Ensuring robust inter-rater agreement is a critical step in validating the quality of observational data.
Statistical Modeling: Quantifying Relationships and Testing Hypotheses
Once multimodal data has been structured and synchronized, Statistical Modeling is employed to quantify relationships between variables, test hypotheses, and draw generalizable conclusions. Given the complexity and often longitudinal nature of observational data, advanced statistical techniques are frequently required. These can include:
- Time-series analysis: For analyzing patterns and trends within continuous data streams (e.g., physiological signals over time).
- Mixed-effects models: To account for nested data structures (e.g., multiple observations from the same participant, participants nested within groups).
- Survival analysis: For studying the duration until a specific event occurs.
- Multivariate statistics: To analyze relationships between multiple dependent and independent variables simultaneously.
Statistical modeling allows researchers to move beyond descriptive observations to infer causal relationships (where experimental control permits) and to generalize findings to broader populations.
Machine Learning Integration: Unlocking Deeper Patterns
Machine Learning Integration is rapidly transforming the analysis of observational data, particularly for large and complex datasets. Machine learning algorithms can identify subtle patterns, make predictions, and even automate aspects of data analysis that are too complex or time-consuming for traditional statistical methods. Applications include:
- Automated behavioral recognition: Training models to automatically detect and classify specific behaviors from video or sensor data (e.g., identifying facial expressions, body postures, or vocal tones).
- Predictive modeling: Building models to predict future behavior, cognitive states, or outcomes based on current and past multimodal data.
- Clustering: Identifying natural groupings or typologies within complex behavioral or physiological data.
- Feature extraction: Automatically identifying salient features within raw data that are most relevant for a particular research question.
Machine learning offers powerful tools for uncovering hidden structures and relationships within multimodal data, complementing traditional statistical approaches and enabling new avenues of inquiry. However, it requires careful validation and interpretation to avoid overfitting and to ensure the generalizability of findings.
Conclusion
Multimodal data can generate richer behavioral insights, but only when synchronization, annotation quality, temporal alignment, and analysis methods are handled systematically. Observation labs need workflows and tools that support reliable data capture and interpretation.
FAQ - Frequently Asked Questions
What is multimodal data in behavioral research?
Why is multimodal data difficult to manage?
What is sampling-rate mismatch?
Why is manual synchronization a problem?
What is clock drift, and why does it matter?
What are behavioral timelines?
Why is inter-rater agreement important?
How is machine learning used with multimodal data?
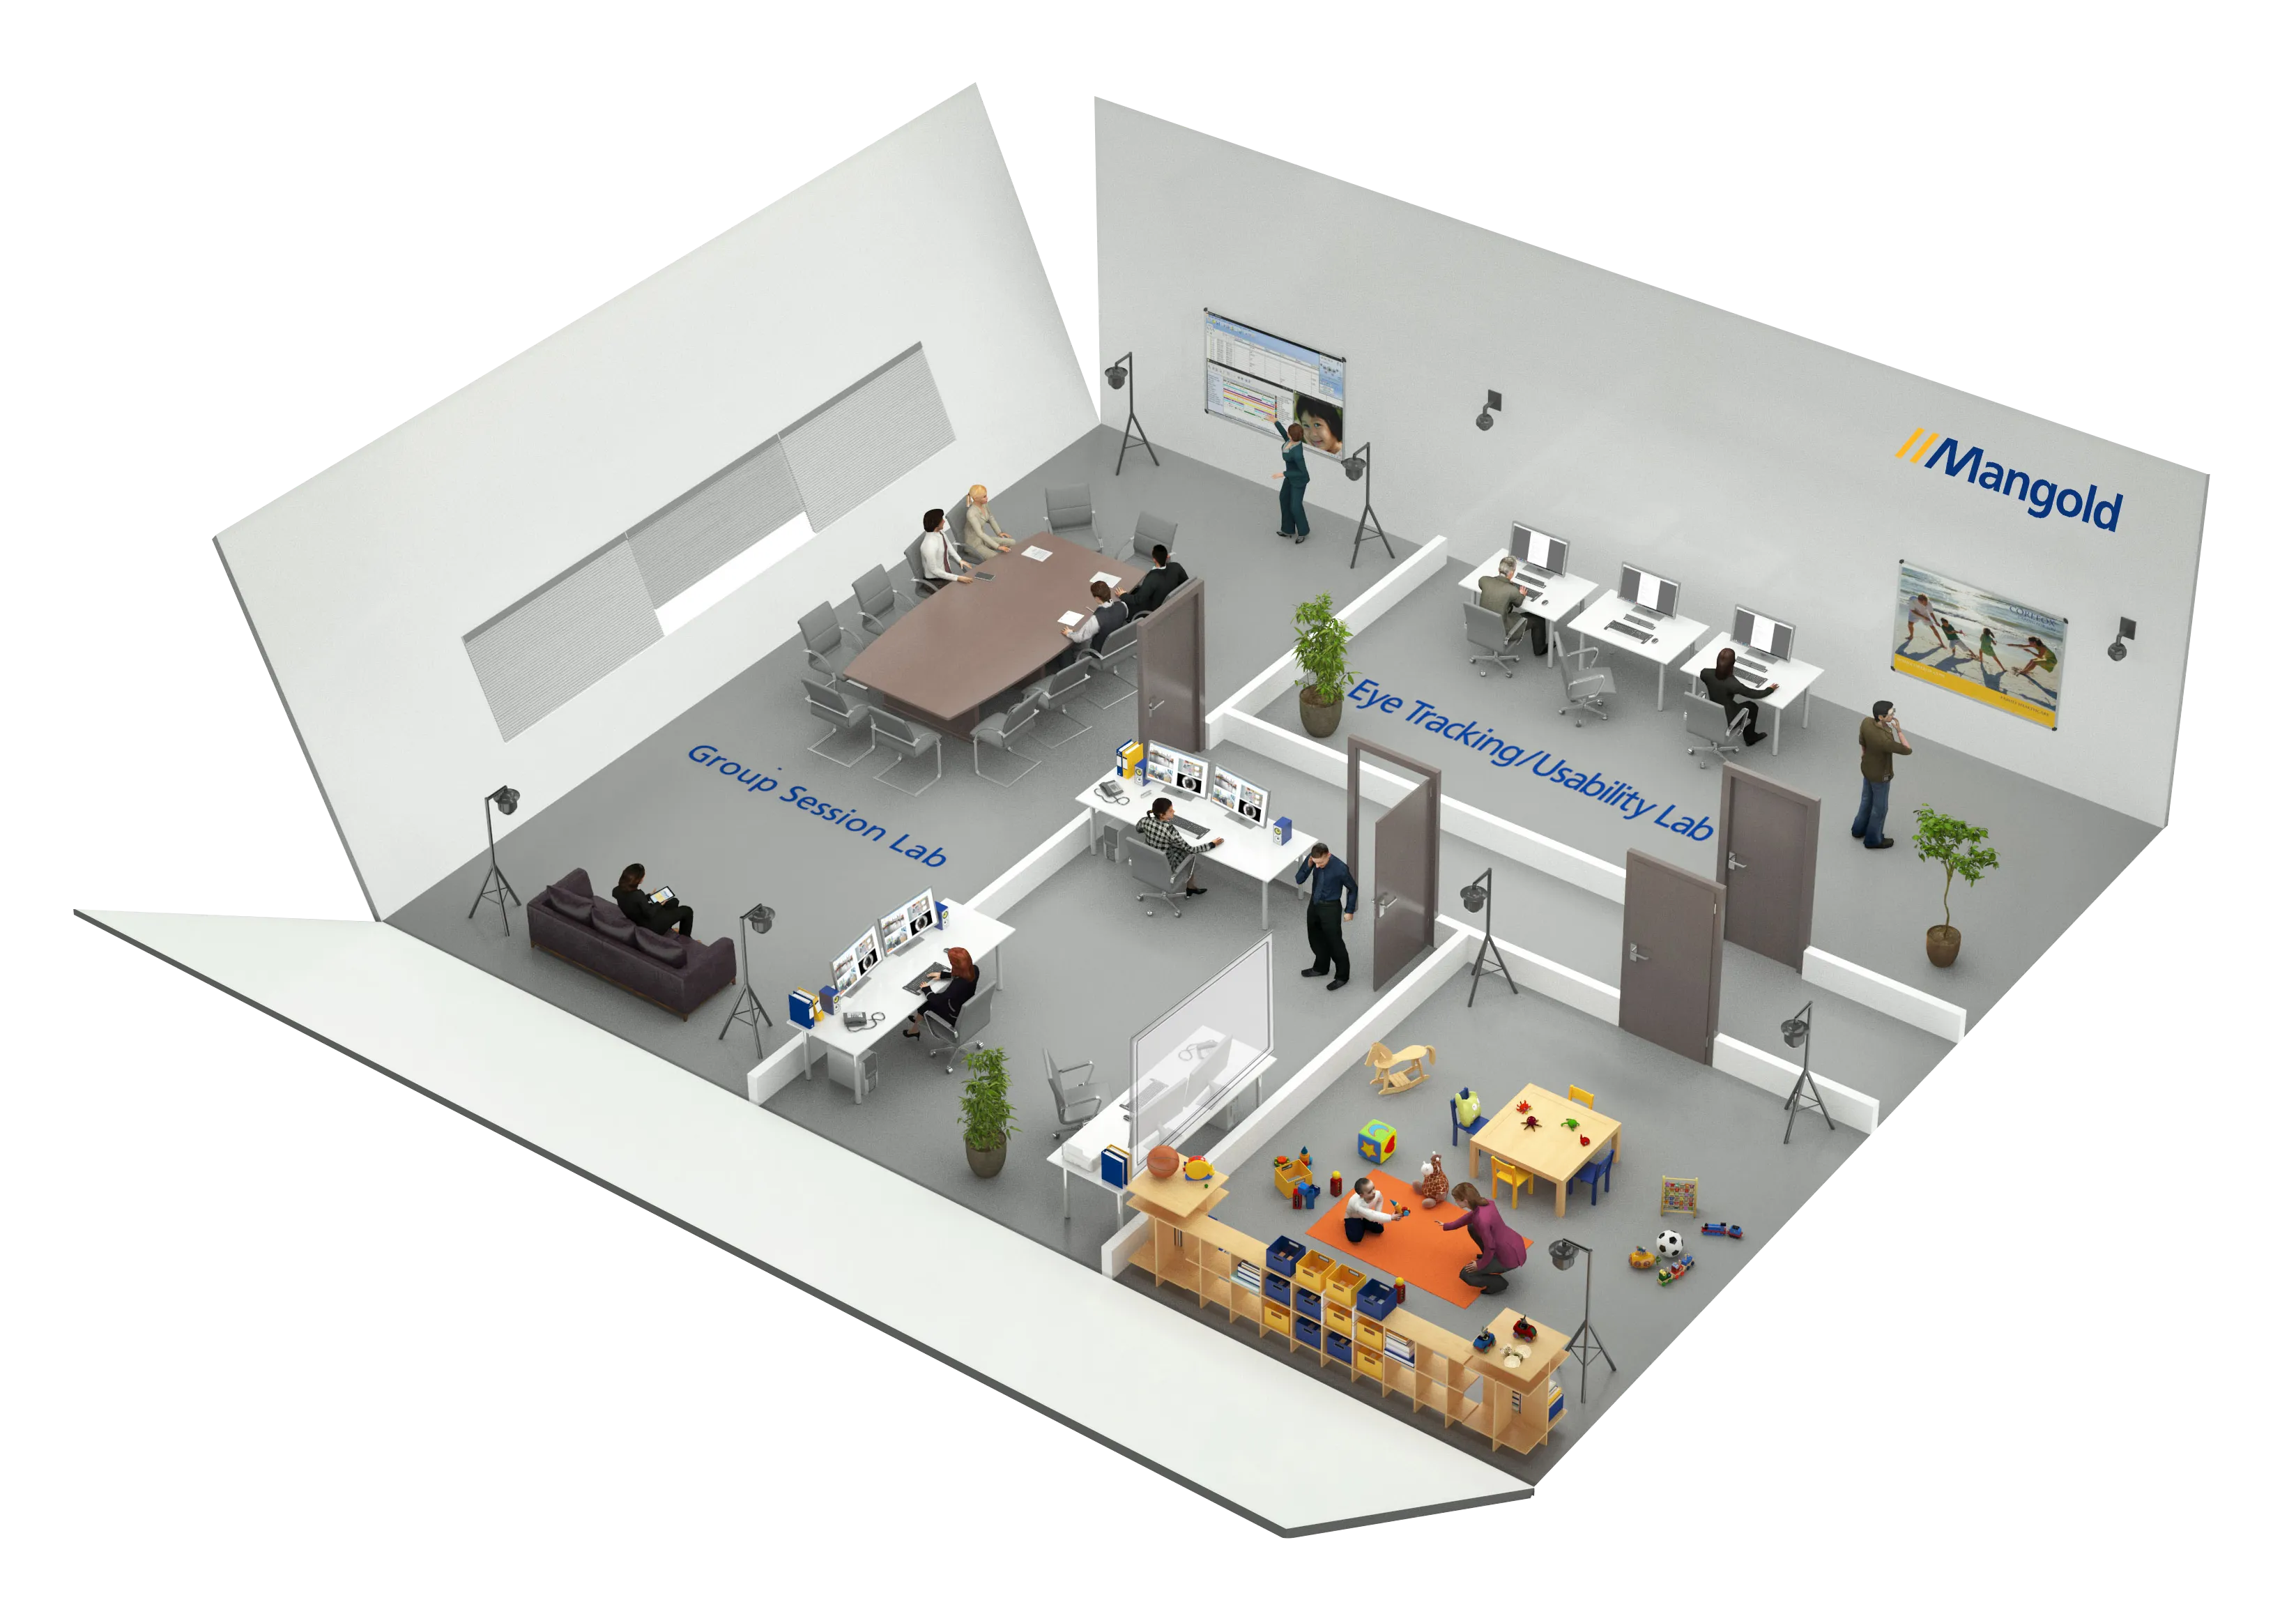
Mangold AV Observation Labs
Mangold AV Observation Labs are comprehensive turnkey solution for conducting behavioral research and observation.