Native macOS + Windows · Python · GDPR-Compliant Whisper AI
INTERACT – Behavioral Coding Software with Python Integration on macOS and Windows
Why Researchers Choose Mangold
Cross-Platform: Native macOS and Windows Support
Research teams often work in parallel on Windows and macOS. Mangold INTERACT runs natively on both platforms with 100% data compatibility – one license covers both, making it ideal for mixed Mac/PC teams.
Open Architecture with Python Integration
INTERACT offers Python integration for custom analysis workflows – researchers can tap into thousands of scientific libraries and embed their own analytical logic directly into the toolchain.
A Complete Toolset in a Single Application
Coding, data management, multimodal data synchronization, inter-rater reliability, state-space grids, lag sequential analysis and contingency analysis – all in one tool.
Expert Guidance, Not Just a Software License
Mangold staff understand observational research. They speak the language of researchers – sequence analysis, dyadic interaction, coding schemes – and actively contribute to research projects when questions arise.
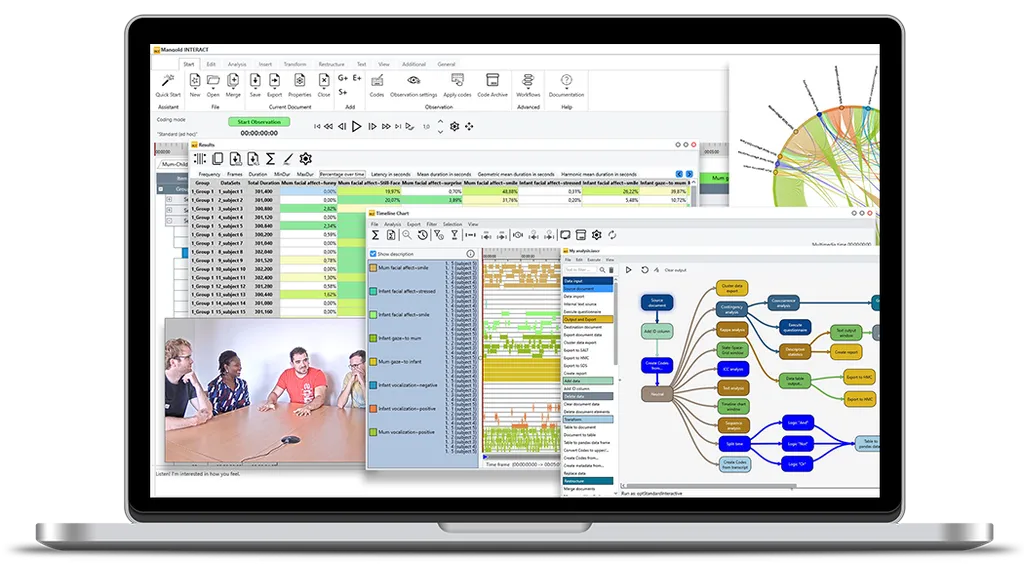
Easily code, transcribe, and analyze your audio and video data using INTERACT’s powerful features.
Achieve research results more efficiently and faster than ever before.
Unlimited Coding Options
Create and manage individual coding schemes of almost any size and complexity to meet your specific data collection and coding needs.
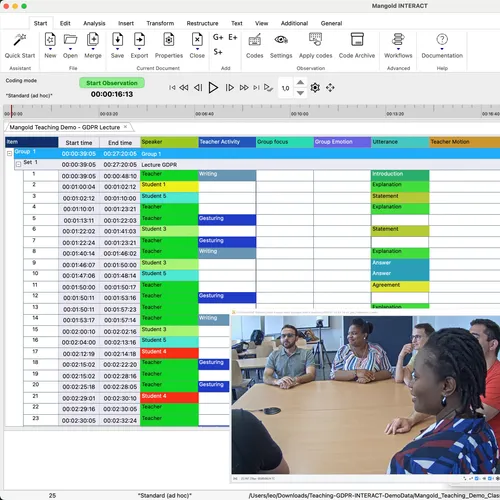
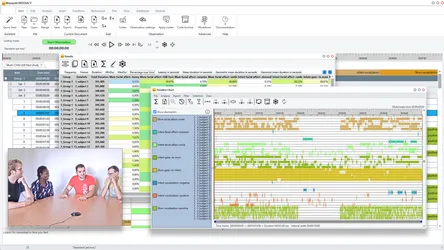
Synchronized Multi-Stream Coding
Code multiple simultaneous audio and video files with automatic temporal coherence - no manual sync needed.
Comprehensive Data Analysis
Utilize powerful software functionalities for data restructuring and advanced analysis options tailored to your research needs.
Get the Result Quickly.
Use the extensive software documentation, training videos and excellent support from Mangold to achieve the desired results quickly.
What you can do
Built for every behavioral research paradigm.
Whether you're studying infants, animals, clinical populations, or human factors - INTERACT adapts to your methodology, not the other way around.
Developmental psychology
Mother-child and parent-infant interaction coding
Neuroscience & physiology
Sync video with EEG, ECG, and sensor streams
Animal behavior
Field and lab-based ethology
UX & human factors
Usability testing, interaction and task analysis
Classroom research
Teacher-student interaction and learning behavior
Powerful Data Collection
Create custom coding schemes for unparalleled data collection flexibility.
Unlimited Coding and Transcription
Code your audio/video recordings based on your individual coding schemes and capture transcriptions in practically limitless scope for any time period of your observation material.
Multiple Sampling Methods
Easily adapt the data acquisition to the current codes and observation conditions by combining time and event sampling, ad libitum, continuous, scan or one-zero sampling and variants as required.
Synchronous Media Handling
Code several simultaneously recorded audio and video files at the same time, while INTERACT ensures the temporal coherence of the different media.
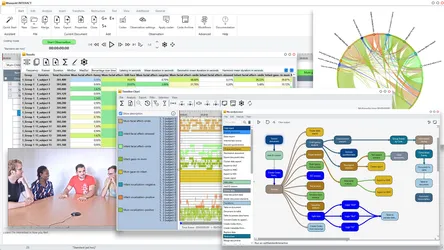
Advanced Analysis
Transform raw data into meaningful research insights.
Comprehensive Analysis Tools
Explore your data through flexible data combinations, state-space-grids, timeline charts, lag sequential analysis and more.
Combine Qualitative and Quantitative Data
Combine qualitative observations with quantitative data like physiological measurements to reveal deeper patterns.
Custom Scientific Analysis
Perform specialised scientific data analysis tailored to your research using Python integration and custom workflows.
Unlimited Analysis Options
Use the extensive data restructuring functions and analysis options in INTERACT and gain new insights from originally simple observation data.
Easily merge, combine and rename collected data
Perform classical sequence analysis
Search for code sequences / patterns
Use contingency analysis
Analyze observer agreement
And much more...
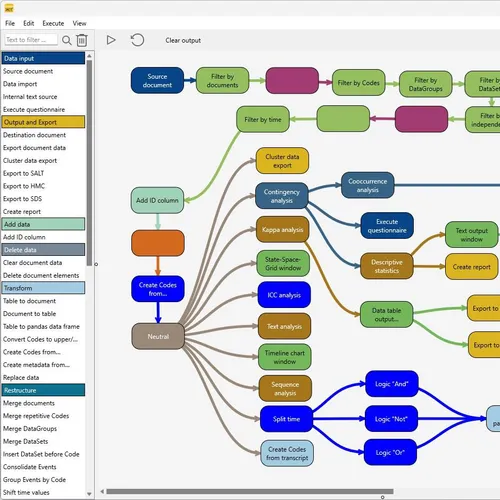
Use Your Personal Workflow
Standardize your research process by using INTERACT's workflow extensibility.
Design Custom Analysis Workflows
Create tailored workflows for your standard analysis routines to derive unique insights from your data.
Seamless Data Exchange
Easily import and export data to collaborate with colleagues or integrate data from and into your individual chain of tools.
The Sky is the Limit
Use Python to create your own workflow, giving you the freedom to perform almost any data manipulation and analysis.
What Experts Say about INTERACT

Ruth Feldman, Prof. Ph.D.
Best Female Scientist 2022, Expertscape World Expert, Herzlia Israel
" Our experience with INTERACT was excellent. The software is friendly, intuitive to use, gives precise results and supports comprehensive behavioral pattern analysis. "

Heather Henderson, Prof. Ph.D.
University of Waterloo, Canada
" INTERACT has revolutionized our approach to data analysis, ensuring precision and real-time adaptability. "

Jana Uher, ao. Prof. Ph.D.
Freie Universität Berlin, DE
" The coding software INTERACT from Mangold proved to be extremely useful and efficient for detailed videotape analysis of individual differences in the great apes. "

Dr. Shane Rogers, Ph.D.
Edith Cowan University, Australia
" Mangold INTERACT on the other hand, runs smooth as butter in all aspects - playing videos, coding, statistics, and visualizations. "

Catherine Tamis-LeMonda, Prof. Ph.D.
New York University
" The INTERACT Software is flexible, user friendly and rich in its capabilities. But, more importantly, the support staff at Mangold is unparalleled. "
INTERACT Packages
Choose the package that best suits your needs.
Basic
The comprehensive 360° software solution for data collection, dynamic visualization and data refinement. Get a full-circle tool for every stage of your research process.
-
Full Featured Audio/Video Coding ...
-
Synchronized Media Handling
Observe and manage audio and video footage with a wide range of control and synchronization options.
-
Flexible Data Collection
Benefit from efficient a-hoc and post-hoc data collection, supporting all major sampling methods.
-
Powerful Analysis
Gain insight with a wide range of descriptive statistics, by finding co-occurrences, code latencies, and contingencies.
-
Advanced Data Transformation
Transform your data to gain new insights by connecting originally unrelated data.
-
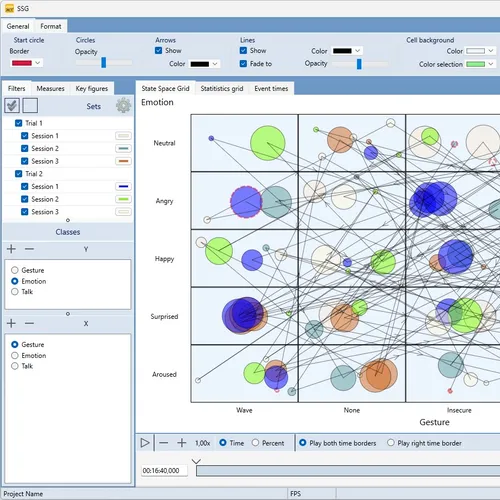
Powerful Visualizations
Explore data with powerful visualizations, such as timeline charts and state-space grids.
Professional
More options including sequence analysis, additional visualizations, custom workflows, and a video editing module.
-
Everything from Basic plus ...
-
Custom Workflows
Define customised data management and analysis workflows for efficient and streamlined processes within research teams.
-
Sequence and Pattern Analysis
Analyze sequences and patterns of events and their relationships with other data.
-
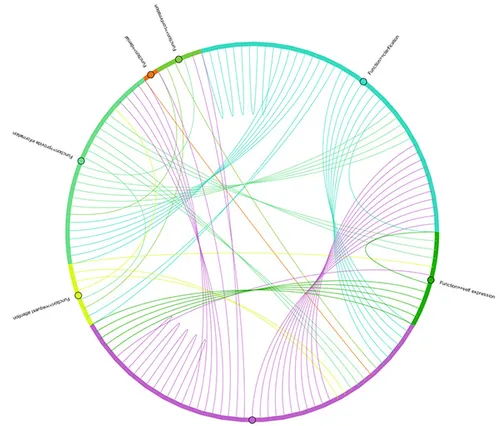
Advanced Visualizations
Explore data with advanced visualizations, such as box plots, word clouds and sankey charts.
-
Automatic Video Editing
Let INTERACT create highlight video clips based on your research data, which can easily be used for training or feedback purposes.
Premium
Offers most comprehensive features including Python integration, sensor data support, and AI-powered automatic transcription.
-
Everything from Professional plus ...
-
Sensor Data Integration
Synchronous visualization of numerical values alongside video recordings, such as physiological measurement data.
-
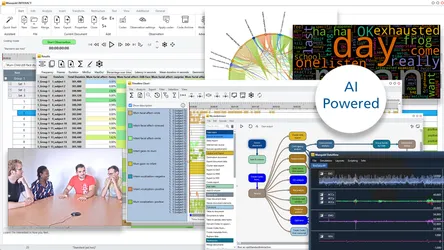
AI-Powered Transcription
Secure, offline auto-transcription using Whisper, including speaker detection.
-
Python Integration
Use Python for advanced, sophisticated data analysis with the built-in Python module (Requires Python knowledge).
Ready to Transform Your Research?
Join researchers from 80 of the top 100 universities in the world today.
Detailed Package Comparison
Compare the features of the different packages.
Showing features for
Light
Request PricingBasic
Request PricingProfessional
Request PricingPremium
Request PricingSelect Package to View
Need more help?
Our experts are ready to help you find the right INTERACT solution for your research workflow. Get personalized guidance on the best package for your needs.
Frequently Asked Questions
What is Mangold INTERACT and what is it used for?
INTERACT is a software for behavioral coding and video analysis in observational research. It enables the coding, transcription and analysis of audio and video recordings with custom coding schemes – supporting event sampling, time sampling and continuous coding across multiple synchronized audio/video files. Researchers in psychology, neuroscience, ethology, UX research, education and similar fields have relied on it for over 35 years.
How does Mangold INTERACT differ from other behavioral coding tools?
INTERACT offers three structural advantages that are unique in this combination: (1) Native macOS and Windows support with 100% data compatibility – one license for mixed Mac/PC teams. (2) Python integration for custom analysis workflows with access to thousands of scientific libraries. (3) GDPR-compliant AI transcription that runs offline on your own computer – no cloud transfer of sensitive research data. Methodologically, INTERACT covers the entire research workflow in a single tool: data acquisition, data management and advanced data analysis – including state-space grids, lag sequential analysis and contingency analysis.
Is INTERACT an alternative to open-source tools?
Yes. INTERACT offers the flexibility of open-source behavioral coding tools, complemented by professional support, AI transcription, multi-data-stream synchronization (sensor data such as EEG, ECG, motion, etc.) and powerful analysis tools. Mangold has been continuously developing INTERACT for 35+ years and additionally provides scientific guidance, training and direct points of contact – added value that is structurally missing from open-source tools. This becomes particularly relevant when complex questions about data acquisition or data analysis arise during a project, or when technical issues occur (typically: Windows / macOS / Python updates) and the software being used suddenly no longer runs smoothly mid-project.
Which video formats does INTERACT support?
INTERACT supports most common video formats, including MP4 and AVI – also recordings from smartphones, action cameras and professional equipment. Multiple video files can be played back and coded in sync, regardless of source or frame rate.
Which data modalities can I synchronize with INTERACT?
Using the DataView add-on module, INTERACT synchronizes video and audio recordings with physiological data streams such as EEG, ECG, GSR, EMG and accelerometry, or any other data stream that contains numerical values and time stamps or a known sampling rate. External data streams can be imported via standard formats such as EDF, BDF and CSV and linked precisely in time with observational data – ideal for multimodal behavioral research, when qualitative content coding is to be combined with quantitative measurement data.
How does the Whisper AI transcription in INTERACT work?
INTERACT Premium uses the Whisper AI model exclusively offline on your local computer. It does not transfer any audio data to external cloud providers, is therefore GDPR-compliant and supports speaker diarization and recognition. This allows audio and video files to be transcribed fully automatically and integrated directly into your coding analysis.
Can I calculate inter-rater reliability with INTERACT?
Yes. INTERACT includes built-in tools for calculating inter-rater reliability (IRR), enabling multiple coders to work independently on the same dataset and then compare results using standardized agreement measures such as Cohen's kappa.
Can I automate analyses in INTERACT?
Yes. INTERACT includes an integrated workflow editor for building reusable analysis routines. For advanced automation, the Python integration allows you to write custom scripts for data manipulation and analysis directly within the INTERACT environment.
Does INTERACT run on Mac?
Yes, Mangold INTERACT runs natively on macOS and Windows and offers 100% cross-platform functionality and data compatibility. A single INTERACT license can be used on both platforms, allowing you to work in a mixed system environment with Windows and macOS devices.
What licensing options are available – including for universities and students?
INTERACT is available in three packages: Basic, Professional and Premium. A free trial version can be requested. Special conditions for educational institutions and students are available on request.