

Product · 6 min read
Which Commercial Evokes the Strongest Response? A Multimodal Research Demonstration
Exploring audience responses through synchronized video, physiological measurements and interactive reports: a four-participant demonstration study with Mangold Observation Studio.
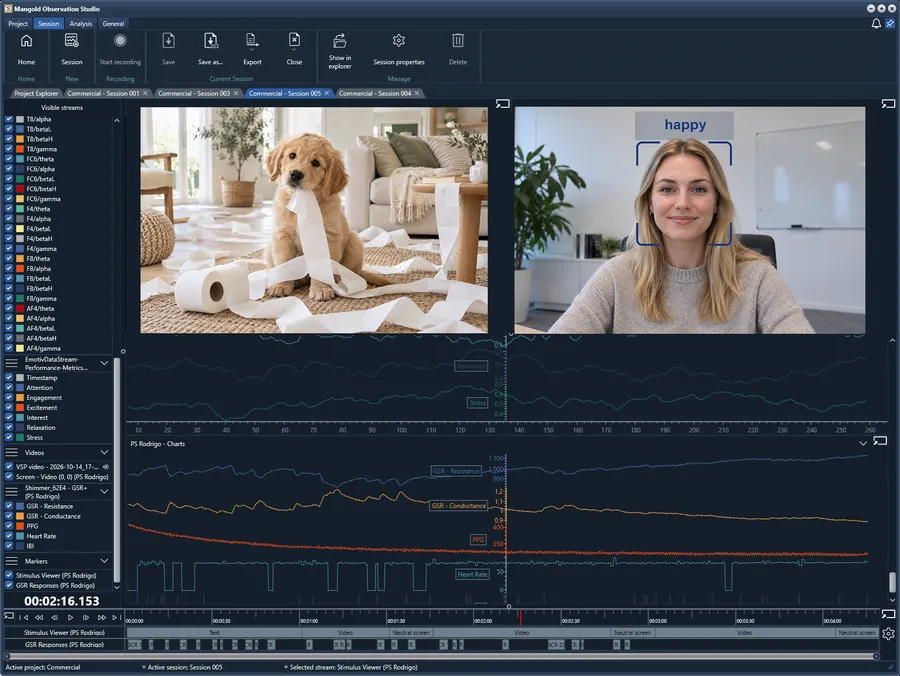
Exploring audience responses through synchronized video, physiological measurements and interactive reports.
Every commercial tells a story. But how do viewers actually respond as that story unfolds?
Traditional advertising research often relies on questionnaires, interviews or individual measurements. These methods provide valuable information, but one challenge remains: connecting a participant’s response to the specific moments of a commercial.
What if researchers could bring video recordings, physiological signals and participant responses together — and explore them within the same research environment?
That is exactly what we wanted to demonstrate with a small Advertising Response Demo Study using Mangold Observation Studio.
The Research Question: Which Commercial Evokes the Strongest Response?
For this demonstration, we presented a selection of commercial videos to investigate how participants responded while watching different advertisements.
The objective was straightforward: record physiological and observational data, identify measurable reactions and explore how those reactions differed between commercials and participants.
The demonstration involved four participants, each recorded in an individual session.
Using the optional Mangold Experiment Designer, the study followed a structured procedure:
- An initial 60-second relaxation phase.
- Commercial videos presented in randomized order.
- A 15-second blank-screen interval after each video.
This provided a consistent experimental structure for collecting and comparing responses to the different stimuli.
Capturing More Than Just the Video
Watching a commercial is only part of the experiment. Understanding how a participant responds requires additional information.
For this demonstration, Observation Studio combined several data sources:
Webcam recording captured the participant during the experiment.
Screen recording documented the presented video content.
EEG recording contributed a brain-activity data stream.
Skin conductance recording (GSR) provided information about changes in physiological arousal.
The Participant Station transmitted the recorded streams to Mangold Observation Studio, where they could be viewed and recorded in synchronization.
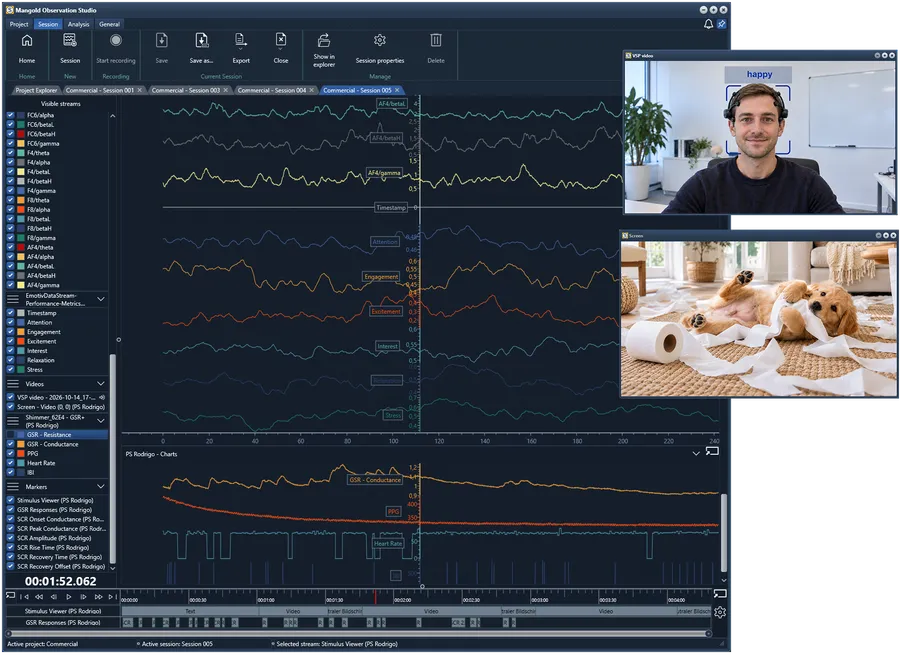
Instead of collecting disconnected recordings and trying to align them afterwards, researchers had access to the information within a shared timeline.
This is one of the fundamental advantages of multimodal research: different measurements can be examined in relation to the same events.
Finding the Moments That Matter
Physiological signals become especially interesting when they can be connected to what a participant was experiencing at a particular moment.
Consider skin conductance.
Changes in skin conductance can indicate changes in physiological arousal. However, the signal alone does not explain what was happening on screen or whether the response was associated with a positive or negative emotional experience.
By recording the stimulus and physiological data together, researchers can examine when a response occurred and which parts of the commercial were presented during the corresponding time interval.
In the demonstration, Mangold Observation Studio’s GSR analysis functionality was used to calculate skin conductance response metrics and generate results for further examination.
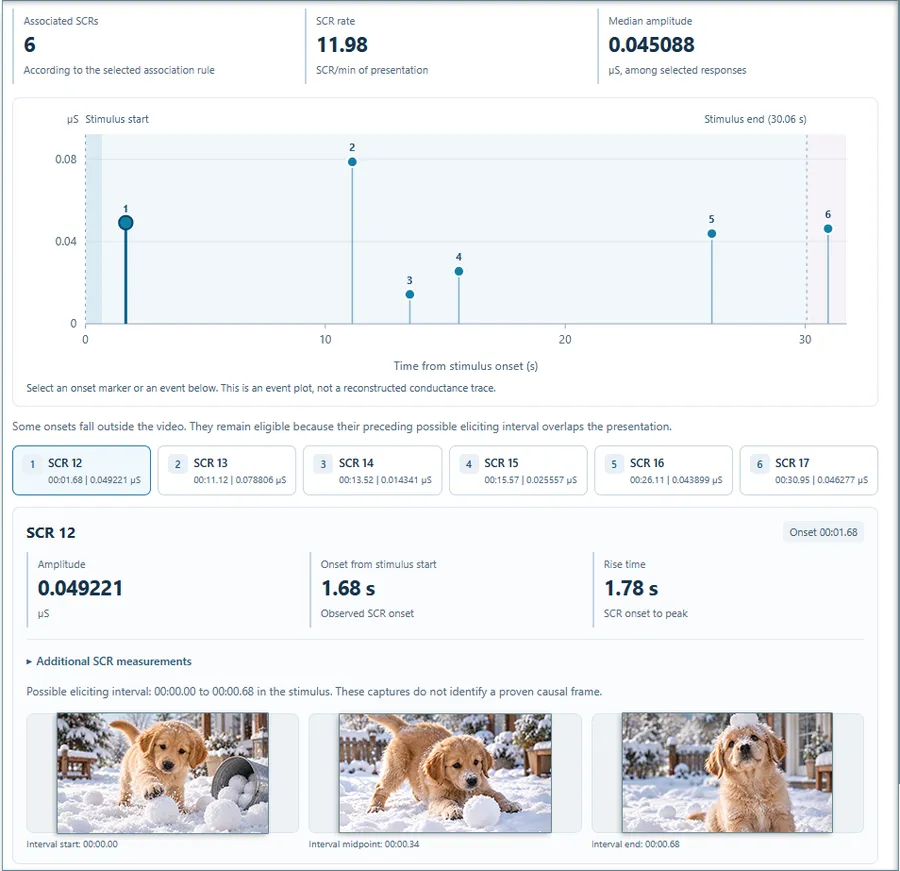
Researchers could review the recorded commercial alongside the physiological signals and explore relevant moments in context.
The important difference is not just seeing that a response occurred — it is being able to investigate that response in relation to the recorded experience.
From Individual Recordings to Interactive Reports
Recording synchronized data is an essential first step. But what happens when researchers want to compare the results of several participants?
This is where the optional Stimulus Response & Comparison Reports become particularly valuable.
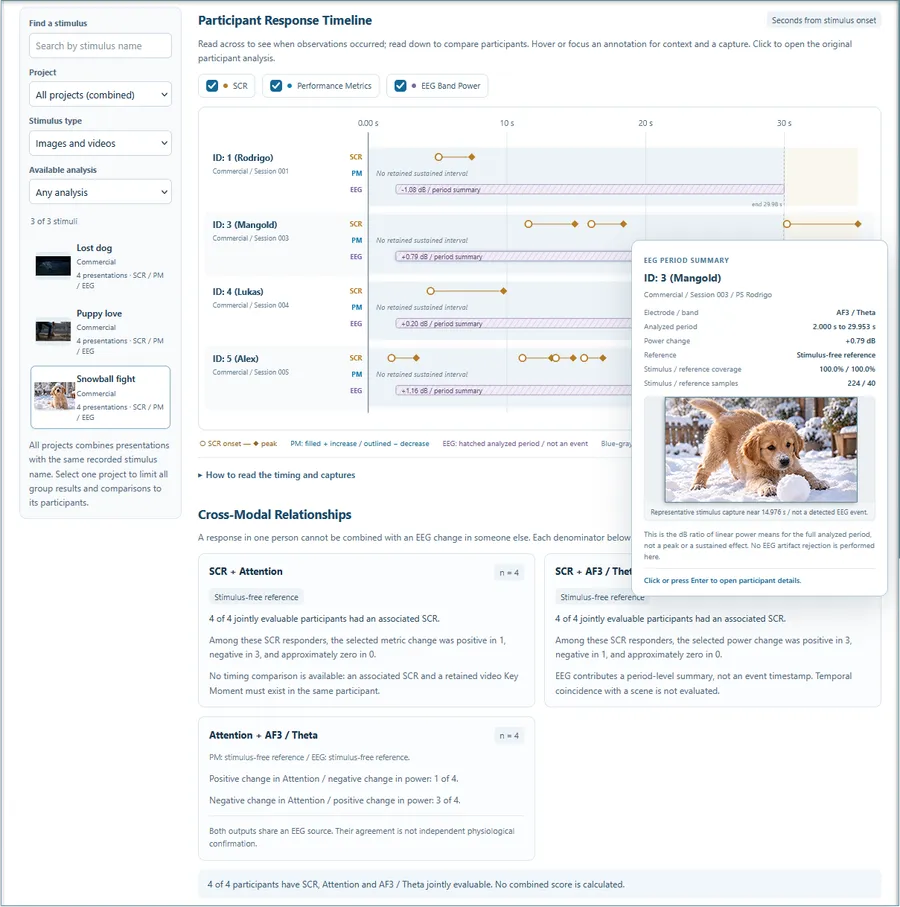
The demonstration shows an interactive report generated from the recorded and analyzed data.
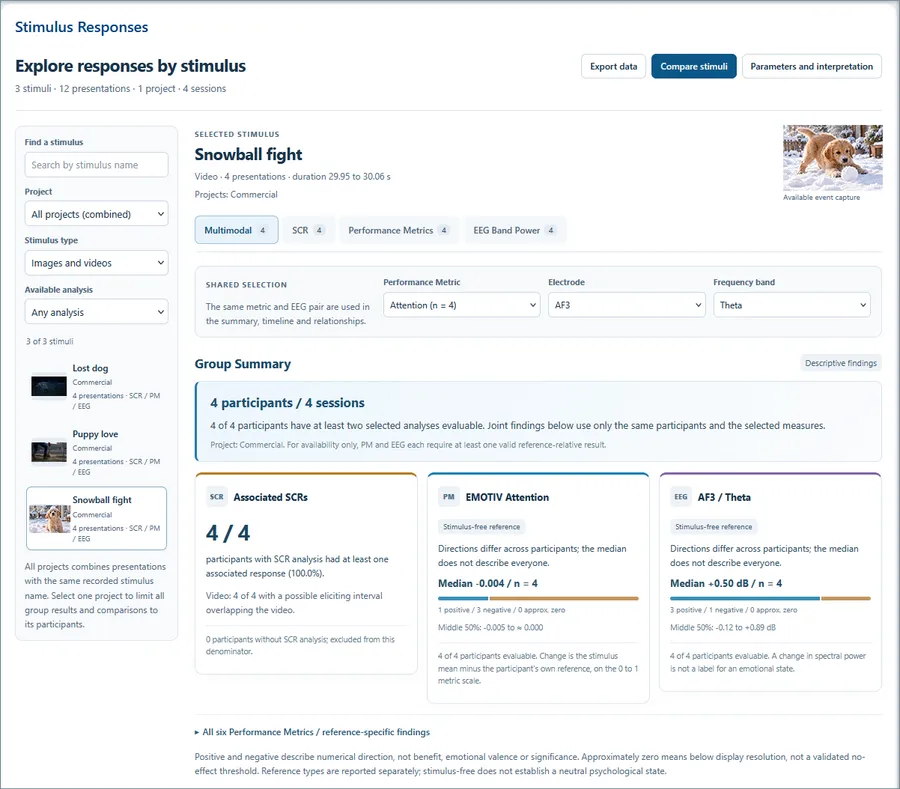
The report brings together information from four recording sessions and organizes the results around the presented stimuli.
Researchers can explore individual participants, inspect available measurements and examine response indicators along the stimulus timeline.
The multimodal response view is especially useful.
It displays response information from different recorded streams in relation to the same stimulus. Researchers can inspect response intervals and view the corresponding stimulus content, making the relationship between a measurement and a recorded event easier to investigate.
Rather than switching between unrelated files, the researcher can follow a coherent analytical workflow.
Comparing Commercials Across Participants
The next step is one of the most interesting parts of the demonstration: comparing the results for different commercials.
The interactive report provides stimulus comparison views that allow researchers to inspect available performance metrics and physiological response measures across the selected advertisements.
This makes it possible to investigate questions such as:
- Which commercials were associated with stronger responses on a selected measure?
- Did different participants show similar or different response patterns?
- Were particular moments associated with noticeable changes in physiological activity?
- How did the available measurements differ between the presented stimuli?
Importantly, different measures describe different aspects of a participant’s response.
A stronger skin conductance response does not automatically mean that someone liked a commercial more. Similarly, recording EEG activity does not by itself reveal a participant’s emotions or preferences.
The purpose of multimodal analysis is to provide researchers with complementary evidence that can be interpreted in the context of their research questions.
What This Demonstration Shows
The Advertising Response Demo Study was designed as a small product demonstration, not as a representative consumer research study.
With four participants, it cannot establish which commercial is generally more effective or produces the strongest emotional response across a wider audience.
It also cannot prove that a particular scene caused an observed physiological reaction. Physiological responses have temporal characteristics, and an observed response may be associated with a time interval rather than one precisely identifiable event.
Nevertheless, the demonstration illustrates several important capabilities of Mangold Observation Studio:
Synchronized multimodal recording: Bring different recording sources together within one research environment.
Contextual exploration: Review physiological measurements alongside the stimuli and participant recordings.
Integrated analysis: Calculate relevant response measures with the appropriate analysis modules.
Cross-participant reporting: Explore stimulus-related results across multiple sessions and participants.
Interactive comparison: Investigate how different stimuli relate to available response measures.
Together, these capabilities support the journey from raw experimental recordings to structured, interpretable research information.
Beyond Advertising Research
Although this demonstration focuses on commercial videos, the underlying research workflow is relevant to many other fields.
A usability researcher might investigate how participants respond to particular interface elements.
A psychologist might examine physiological changes during controlled stimulus presentations.
A human factors researcher might study how users respond to specific events during interaction with a digital system.
In each case, the fundamental challenge is similar: connecting different forms of observational and physiological evidence to the events under investigation.
Mangold Observation Studio helps bring these elements together, with optional analysis and reporting capabilities that can be selected according to the needs of the study.
From Recording to Research Insights
The real value of a multimodal research platform is not simply how many data streams it can record.
It is what researchers can do with those recordings afterwards.
By connecting stimuli, synchronized participant data, physiological measurements and interactive reports, Mangold Observation Studio provides an integrated environment for exploring human responses.
This advertising response demonstration offers a practical glimpse of that workflow — from experiment design and synchronized recording to analysis and cross-participant comparison.
One experiment. Multiple data sources. A clearer view of the observed responses.
Explore Mangold Observation Studio
Discover how synchronized multimodal recording and optional analysis modules can support your research.
Explore Mangold Observation Studio
Study note: This article describes an illustrative four-participant demonstration. The results are not intended as generalizable findings about advertising effectiveness, emotional preference or causation.